You will acquire knowledge about how to find the right color with the spectrophotometer quickly.
MOVIES
DIGITAL COLOR RETRIEVAL - PREPARATION
DIGITAL COLOR RETRIEVAL - CALIBRATION
DIGITAL COLOR RETRIEVAL - MEASUREMENT
INTRODUCTION
For efficient and effective automotive refinishing, finding the right color is essential.
Over the years, the range of colors has grown by leaps and bounds (wider range of models & colors using metallic, pearl, multilayer, and individual colors), which has led to an ever-increasing demand for improved color-matching systems and techniques.
Advantages:
- Easy
- To use the spectrophotometer, you need to have only basic technical and color-related skills.
- Portable
- The device can be used anywhere in the collision repair center, allowing flexibility for which technicians use it. It does not need to be an expert painter.
- You can take multiple color measurements in succession
- You can handle the entire day’s business at once, doing successive jobs without having to enter the order information ahead of time, since the order information is quickly entered on the device directly after each measurement.
- Precise
- The spectrophotometer allows you to find the right color quickly.
- Complete
- The spectrophotometer will provide you access to the complete color database. No more waiting for color chip updates to arrive or wasting time updating the cabinet. With the spectrophotometer, you are not limited to the standard and select variants that were included in the cabinet. Using the spectrophotometer allows you to compare your measurement against all the formulas in the database.
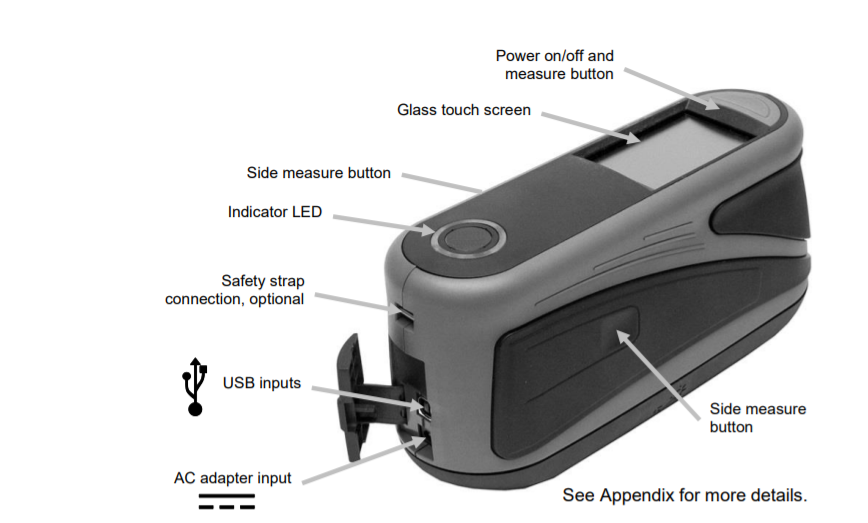
THE SPECTROPHOTOMETER
A spectrophotometer is a complex measurement device capable of measuring color values of the respective surface. It measures the intensity of the light reflected from the surface and in case of a camera equipped device also takes digital images of the measurement areas. The data collected is processed and used for the identification of the best available match from the comprehensive database.
TIPS TO MAINTAIN YOUR SPECTROPHOTOMETER
-
Use the safety loop around your wrist, you never know when something will get knocked from your hand.
- The device should be sent in for re-certification every 2 years.
- Don’t leave the spectro laying around to get dust and paint on the unit. Never leave the device on the mixing table.
- One of the most important aspects of care is removing and reinserting the USB cable into the back of the spectro. This port can be easily broken if someone jiggles it around, picks it up by the cord, or is trying to force the plug back in.
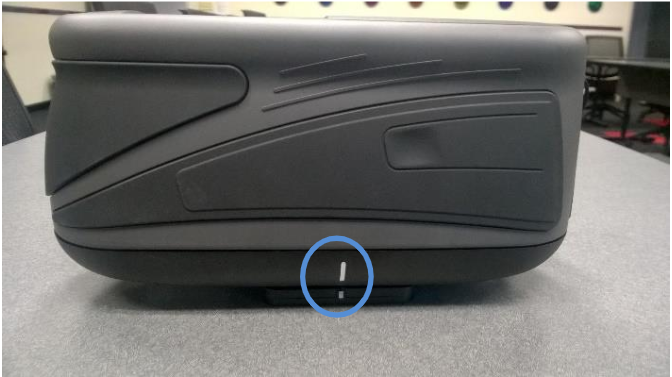
- The door on the bottom seals the unit and it is very fragile. It is printed with a “DO NOT PUSH” message. If pushed it will break off into the unit and it will need to be repaired.
- The calibration tools need to be kept clean and dust free. If not, your calibration will be off, and the device will not return the best results. Store the tiles closed in a dust free area.
- Using the Spectro begins with calibration. This may have to be done at least every 30 days. But if temperature changes dramatically between first usage and later in the day it is a good idea to do it again.
- Temperature of the vehicle is also critical. Too hot or cold will cause bad readings. Bring the vehicle in the building and try to get it and the spectrophotometer to the same temperature. Make sure the area to be read is clean and scratch free.
- Don't place the device on the ground or balance it on the vehicle where it could easily fall off and become damaged.
- Remember that caring for your spectrophotometer will help ease your color matching jobs and increase your production.
SPECTROPHOTOMETER SETTINGS & CALIBRATION
A one-time setup of the Spectrophotometer device will be needed prior to its first use. The device also requires regular calibration to assure consistent measurement quality. The following section will give you an overview of settings and necessary seps for calibration.
Set the measurement Options:
The spectrophotometer takes multiple measurements. In most cases, three measurements are enough if the surface quality is good, and the cleaning process is performed.
Depending on the condition of the surface, up to 12 measurements can be taken.
The goal is to determine a good, reliable average that can serve as the basis for the subsequent identification of the best match-> the more measurements the more accurate is your average!!!
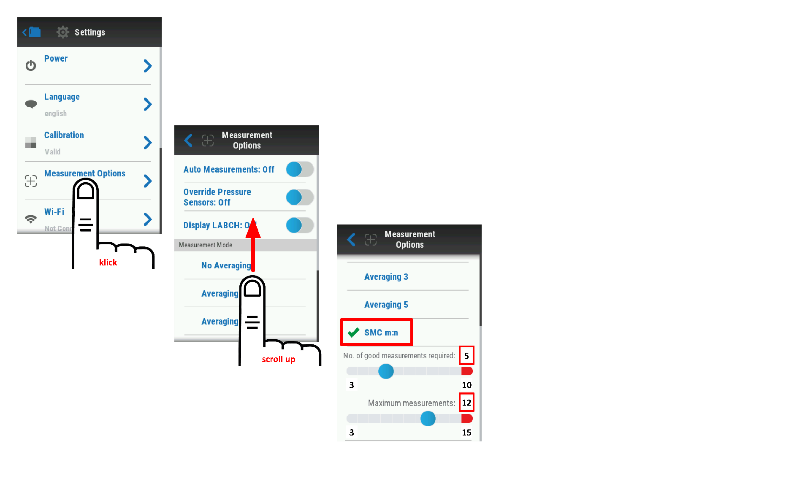
Begin by selecting device settings.
1. Select “Measurement Options”
2. Select “SMC”
3. Set “No of good measurements” to 5
4. Set “Maximum number of measurements” to 12
AUTO MEASUREMENTS
If set to “On” measurements will be taken automatically when all three pins, contact measurement surface.
The Auto Measurements option can be selected to streamline the measurement process by allowing the device to take a measurement automatically, when all 3 pins contact the surface to be scanned.

Begin by selecting device settings.
1. Select “Measurement Options”
2. Set “Auto Measurements” ON
3. Set “Time to start auto measurements” to desired time. This option will allow you to set the time that all 3 pins are in contact before measurement begins.
CALIBRATION
To guarantee accuracy of your measurements, you must calibrate the spectrophotometer every 30 days. A few days before the end of the 30-day period, the spectrophotometer will indicate the need for recalibration. This calibration will compensate for any minor differences that have occurred within the device and assure accurate measurements.
The spectrophotometer is automatically calibrated daily when you turn it on (measuring flap opens automatically and the device flashes once).
 Do not look into the measurement opening during daily calibration.
BASICS OF CALIBRATION
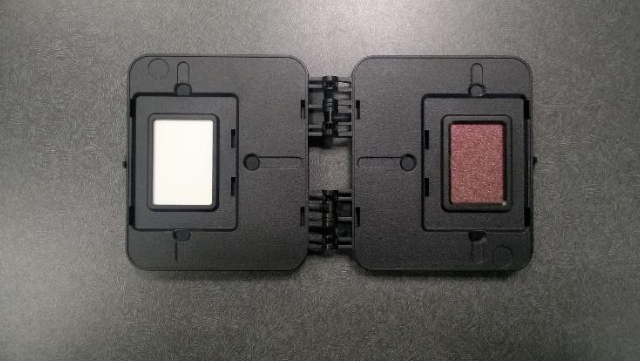
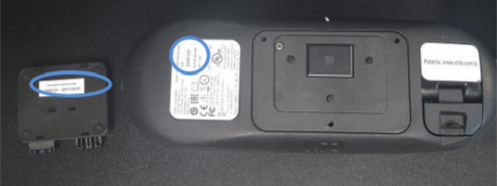
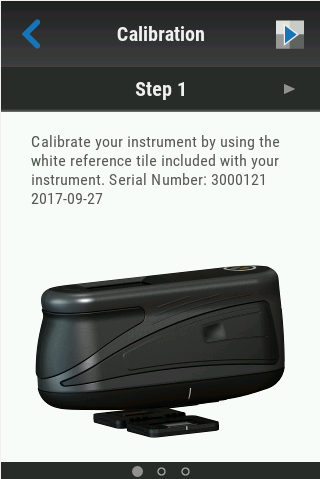
It is important that you use the calibration tile that is associated with the device. The serial number on the device and the serial number on the tile must match.
-
The tile contains both a white and reference (effect)tile for proper calibration of the device.
-
Be sure to keep the tiles clean by storing the plaque in a closed position inside the KOH case when not in use.
-
Before each calibration wipe with a soft, clean lint free cloth such as a microfiber cloth
-
Position the instrument on the white tile, aligning the white indication area on both the instrument and the tile.
-
The instrument will fit tightly into the tile if the indication areas and measurement pins are seated properly into the tile.
DEVICE GUIDED CALIBRATION OF THE DEVICE
There are 2 ways to get to the calibration screen:
 1. From the settings menu select Calibration option
 2. By clicking calibrate button when prompted by device
AFTER SELECTING EITHER OPTION, THE DEVICE GUIDED PROCESS WILL BEGIN
Position the instrument on the white tile, aligning the white indication area on both the instrument and the tile.

After the instrument is properly seated within the tile click the continue arrow to begin calibration of the white plaque.
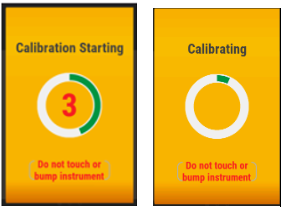
Once the calibration process has started, make sure not to move or bump the device until the calibration is complete.
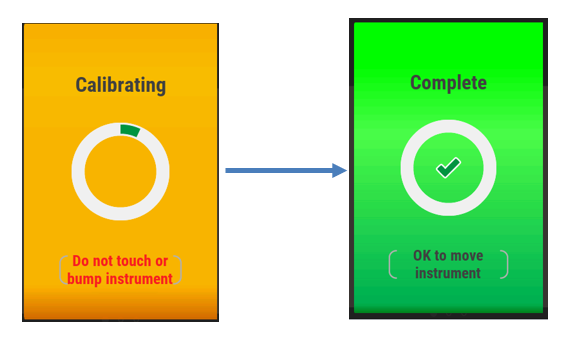
After the white tile calibration is finished a “complete”message will appear.

The next step is to repeat the process with the effect tile of the calibration plaque by seating the instrument into the effect tile side and aligning the instrument and the tile. Then click the continue arrow to begin the calibration on the reference tile.
![]()
Once the calibration process has started, make sure not to move or bump the device until the calibration is complete.
The calibration is now complete.
SELECTION OF THE MEASUREMENT AREA
The selection of the measurement area is an important point as the measurement you take will represent the basis for the best match selection - You have to take the measurement as close as possible to the area where the color match matters the most
If the repair is a blend-in adjacent panel repair, the measurement should be taken on the blend panel, at the far edge of the blend transition zone
If the repair is an edge-to-edge repair, the measurement should be taken on the adjacent panel, where the color match matters the most.
If the repair is a blend-within the panel repair, the measurement should be taken on the blend panel, at the far edge of the blend transition zone
.
PREPARATION
As the spectrophotometer reads the light reflected from the surface, the surface must be in good condition. Surface defects such as scratches and other damage can and will lead to incorrect, or inaccurate measurements which then result in a lower quality of color retrieval. The illustrations show a surface with damage and without damage on the device display.
The spectrophotometer takes multiple measurements. In most cases, three measurements are enough if the surface quality is good. However, depending on the condition of the surface up to 12 measurements may be taken. The goal is to determine a good, reliable average that can serve as the basis for the subsequent suggestion.
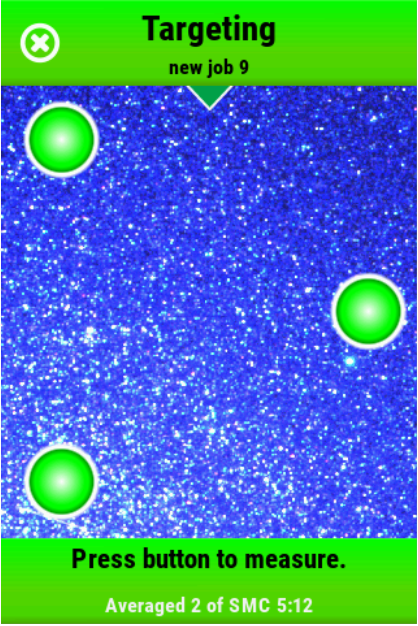
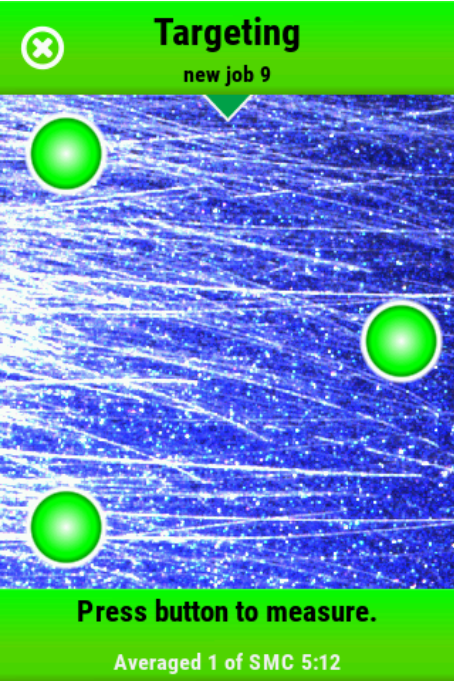
Display before a measurement (with damage)
CLEANING THE AREA OF THE VEHICLE TO BE MEASURED
Prepare the surface you wish to measure.
Before you take the measurement, you must clean the area to be measured to remove wax, silicone and other contamination that could affect the measurement.
You must take the measurement as close as possible to the area to be refinished, preferable on an adjacent body part as described in 3 Selection of the measurement area. This will prevent measuring a body part that has previously had panel repair, where the color may not match the area you wish to repair.
POLISHING THE CLEANED AREA OF THE VEHICLE
After you have cleaned the body part, you must polish it to remove fine surface defects that could affect the measurement results. Due to the remaining film from the polish - depending on the color - measuring inaccuracies may occur. For this reason, a further cleaning of the polished surface/ area is always recommended.
DEVICE CONNECTION AND SETUP IN THE SOFTWARE
FIRST SETUP
When first using a (new) spectrophotometer with your software, you will have to connect and pair the device with your scan software.
To do so, connect your device to your computer using your USB connection cable and select the Spectro module in your software.
 Here, please proceed to the “Settings” menu.
 Select “Manage Devices” to be forwarded to the setup menu.
To add a new device please click “+ ADD DEVICE” (1).

You should give your device an individual naming (2) to be able to later identify it in the software when transferring measurements – this is especially important when multiple devices are used with one computer!
The red sync sign (3) indicates a new Make/Model/Year information is available and your device needs to be updated.
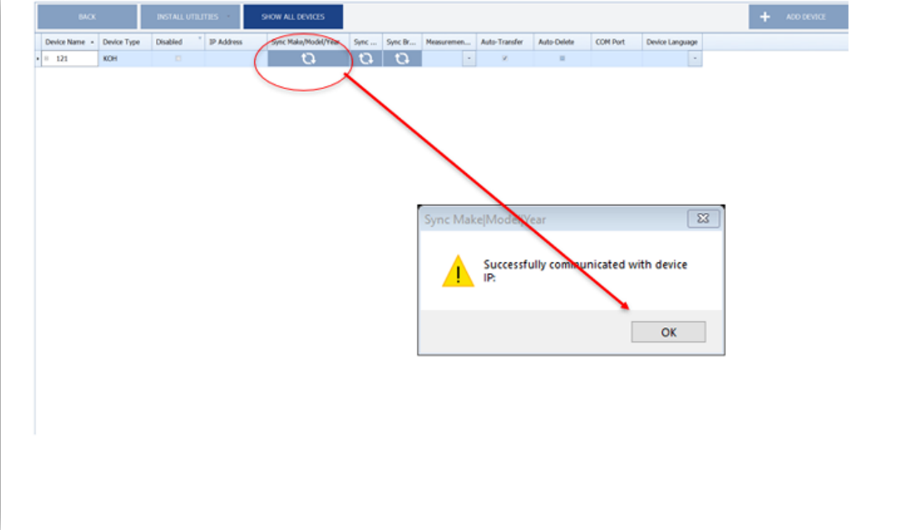
To transfer the new information onto your device, please press the “sync” button – after the data transfer, you will receive a notification of its success.
FIRMWARE UPDATE
While having your device connected to your computer, you might want to check if your device runs with the latest available firmware. Please make sure you connect your device with the power supply as this is a preset for a firmware update.
Now click “INSTALL UTILITIES” button and select “FIRMWARE” and then the spectrophotometer model you are using (here KOH)
A pop up will alert you to be sure the spectrophotometer is connected via AC power and USB. Click “OK”.
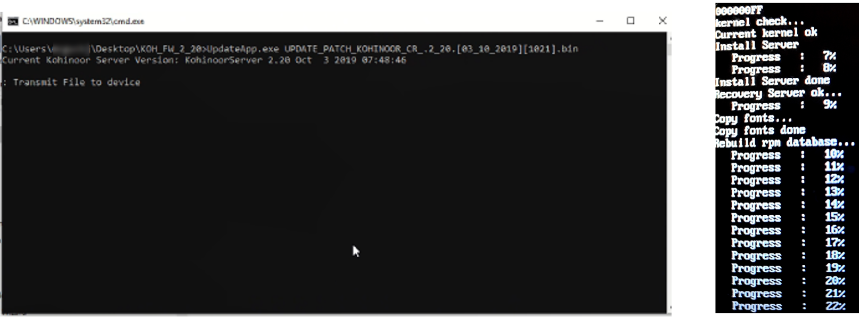
A CMD window will appear letting you know the file is being transmitted to the device.
The progress can also be seen on the spectrophotometer screen. The device will auto restart after the update is complete.
In case the process is not successful, you will receive an ERROR message saying “connect: Not connected”
I such a case, please check your device connection and retry the last steps.

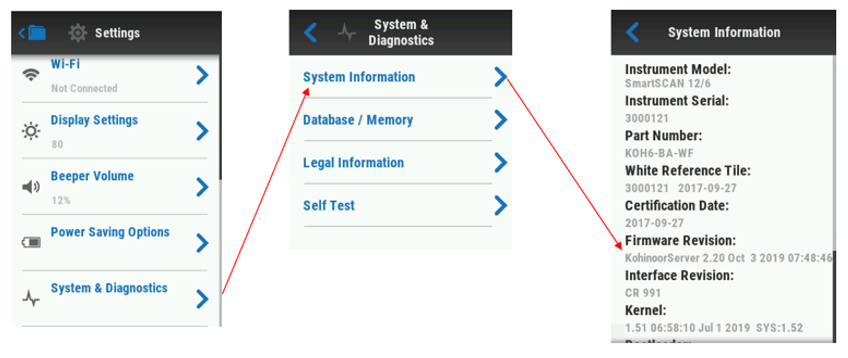
After update is complete and your spectrophotometer has restarted check: Settings -> System and Diagnostics -> System Information
Under “Firmware Revision” you will see the device is now updated to the latest firmware

GENERAL SETTINGS OF THE SPECTRO MODULE
You can customize your setting in the software to optimize your user experience with the spectrophotometer module in the “GENERAL SETTINGS” area

- Jobs in “Best Match” screen transferred within the specified number of days will be shown - the lower the number of jobs displayed the better the software performance
- Specify desired Metallic and Solid paint line you will be using with the spectrophotometer
- Select view you want to see after clicking the “Details” button in “Best Match”
- Setting the transfer frequency if spectrophotometer uses WiFi for measurement transfer
- Please select NO
- Please select YES. This setting allows for second adjustment option.
- Please select NO. This setting allows you to transfer just the last measurement rather than requiring all jobs on the device to be transferred.
MEASUREMENT
DEVICE INTRODUCTION
A Spectrophotometer is a complex measurement device capable of measuring color values of the respective surface and taking its image. It measures the intensity of the light reflected from the surface/wavelength for 12 geometries. At the same time, it takes six photos.
The quality of the measurement is a crucial preset to find the best suitable match for your target. To obtain the best possible measurement follow the surface preparation instructions in chapter "Preparation "PREPARATION"
NOTE: Please remember to use the strap to attach the spectrophotometer to your wrist to prevent it from falling on the ground and becoming damaged.
Avoid heated surfaces - signals and wavelengths emitted by heated surfaces (e.g., due to exposure to sunlight) might influence your measurement and might give wrong results.
The measured values are then analyzed by the color software and used to retrieve the best possible solution available in the color database. With a bad measurement representing your repair target, a database search will not result in a satisfying result.
To visualize the measured color a representation of the formula is displayed as a suggestion for both the retrieved color from the database, and for the customer target read by the device.
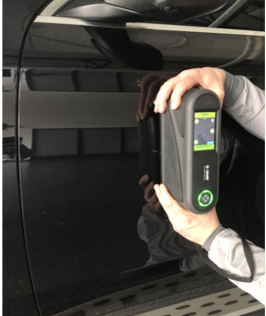
MEASUREMENT: USING THE SPECTROPHOTOMETER TO MEASURE THE VEHICLE
To take a measurement, please turn on the spectrophotometer and press the “+” sign on the upper right of the LCD display once.
Position the spectrophotometer on the measurement area you have identified as described in Chapter “SELECTION OF THE MEASUREMENT AREA”. Once the device is set on the surface (Auto reading selected) it will automatically begin the color reading process.

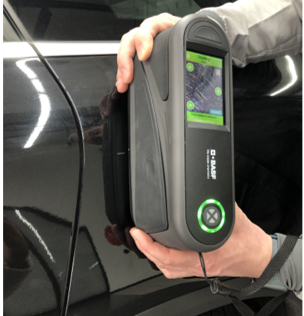
The spectrophotometer begins to take a color reading – during the measurement the screen will appear yellow. Do not move the spectrophotometer and keep it as steady as possible to assure good measurement quality.

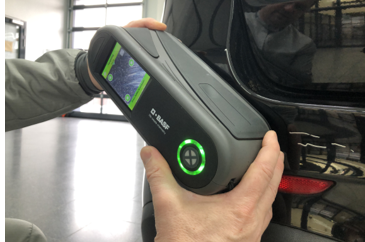
Once the measurement is finalized successfully, the screen on the device will turn green. Proceed to move the spectrophotometer to the next measurement position by lifting it and positioning it again at the next measurement point.
Proceed to repeat the process for the selected number of readings you have chosen for your device which you have chosen as described in chapter "SPECTROPHOTOMETER SETTINGS & CALIBRATION"

REMEMBER: The more measurements the more accurate is your average measurement value! - Maintain one orientation of the device during measurement – avoid “turning” it around.
CREATING ORDERS ON THE SPECTROPHOTOMETER
You will have to create an order on the spectrophotometer device to be able to transfer the measurement data onto the software to process it further.
After your measurement cycle is finished, the order entry window will open automatically.

The minimum entry for an order creation via the LCD display using the stylus, is the “Name” which might be used to capture your order number and the “Make” = Manufacturer.
Proper naming of a measurement will help you to find your measurement while transferring. Also, a constant naming and data management will help you to find the respective job easier in case you need to e.g., exchange with service centers when requesting support.
The data entered on the device screen in the fields “Name” and “Make” will be transferred automatically with the measurement into the software.
TRANSFER OF MEASUREMENT
To process the measurement taken with your device in the software, you need to transfer the measurement date to the software.
To do so you need to connect your device (which you have set up in your software as described in Chapter “DEVICE CONNECTION AND SETUP IN THE SOFTWARE” to your computer.
To begin transferring measurements from your device to the SCAN module transfer into “Transfer Measurements” screen by clicking “Open Menu”.
![]()
You have the option to “Transfer Last Measurement” which will download just the last measurement you took. You will have the option to rename you measurement / order.
In case you have taken multiple measurements for multiple orders which you want to transfer to your software, you might want to use the option “Show all Measurements”.
Upon this selection, all measurements stored on the spectrophotometer download automatically. If this is not the case, and you are using multiple devices, please check if you have selected the right device in the dropdown menu and click refresh.
![]()
Working with “Show All Measurements” option, please select the jobs your wish to transfer and press “Yes” if you would like to delete the selected jobs from the device. This function will only delete jobs from the spectrophotometer, not from the software.
REMEMBER: Regularly delete measurements that are no longer needed on your spectrophotometer – It is advised to keep 10 or less measurements stored on the device for optimum performance.
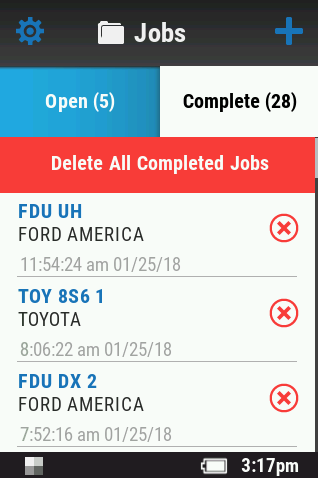
Measurements transferred to the software will be displayed up to 90 days or depending on your settings from chapter "DEVICE CONNECTION AND SETUP IN THE SOFTWARE" will be shown in the “Best Match screen.”
![]()
To change job name, select the current BOLD job name with your cursor. The job name can now be changed.
![]()
SEARCH CRITERIA
SEARCH WITH MFR & COLOR CODE
After the measurements have been downloaded, the software uses the data for a search in the comprehensive database and identification of the best match. The software will also use your measurement to mathematically adjust the result if possible.
To direct the searching algorithm into the right color area and hence improve the search performance, providing info about the repair is needed.

Enter the MANUFACTURER (BMW) and the CODE (C10) of the scan and Click Apply to start the search.
REMEMBER: Formula development at the color labs is based on master panels and cut offs and maintained using the data – by entering your search criteria you are focusing your database search on the relevant formulations (incl. e.g. proper pigments as well as effects and metallics).
Optionally you can review and modify your Search Criteria going to “Details” and “Search Criteria tab.”
Note: Modifying search criteria is a multi-step process. It will be covered in the below.

REMEMBER: Solid colors do not contain any effect or metallic pigments which might be specific to a certain manufacturer. The can be identified by their color remission. You can remove search criteria and evaluate the portfolio of solution returned with the open search.
SEARCH MODIFICATION
Search criteria like “Make/MFR” and “Color Code” are a decisive point in the digital color retrieval process. Generally limiting the search to the relevant area by using as much information as possible will assure the highest search performance and will direct the search in the appropriate area. There might however be cases, like e.g. solid colors or color of group manufacturers, where after performing an intital search you might want to modify your search to evaluate further potential matches.
Some manufactures share colors among their manufacturing group, here the suitable color might be matched and saved using a different “Make/Manufacturer” reference. In case you have evaluated your search results including “Make/Manufacturer” and “color code” and did not find a suitable match, please modify your Search Criteria going to “Details” and “Search Criteria tab” and removing the “Make/Manufacturer.” A search with “Color Code” only might in such cases point you towards a satisfactory solution available.
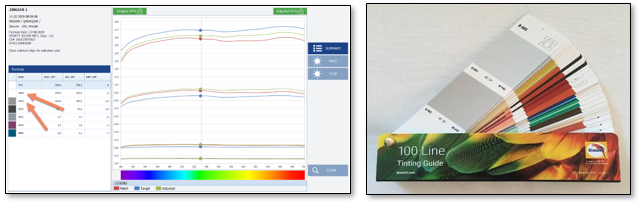
UNDERSTANDING THE DISPLAY
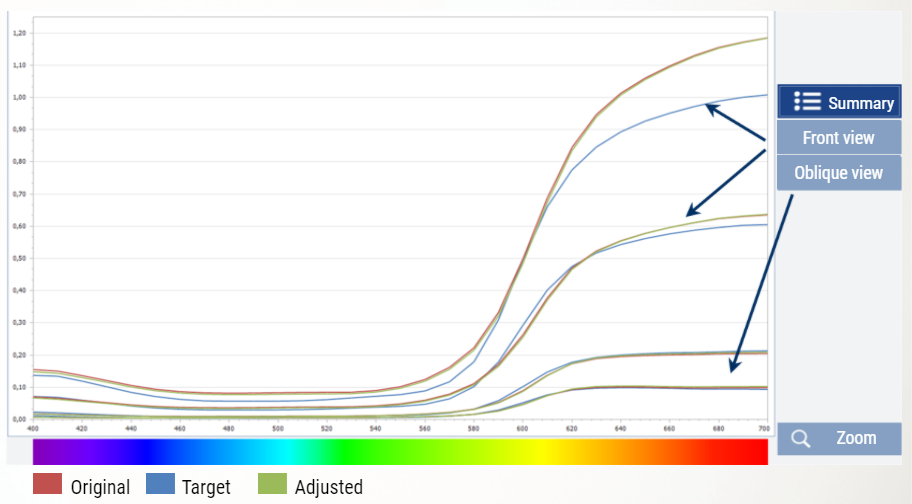
The search results are displayed with a visual representation of the color based on your measurement, the original found in the data base and the mathematical adjustment.
- Calculated color visualization of the formula developed by the color lab, identified by the search algorithm as a possible solution.
- Calculated color visualization of your scan taken at your repair job
- Calculated color visualization of the formula calculated by an algorithm to minimize the difference between "original" and "target".
NOTE: The “adjusted” formulation is based on a mathematical calculation and is not necessarily a better solution than the “original”. Base your decision making on the curve evaluation and confirm your choice with a spray out for optimum results!
EVALUATION OF SPECTRAL CURVES & FORMULA FOR DECISION MAKING
This chapter will introduce you to the basics needed for an educated decision making based on characteristics of your spectral curves and the pigmentation of your formula.
BASICS ON SPECTRAL CURVES
White light contains all the colors of the rainbow in the visible spectrum. When white light falls upon an opaque object, the object interacts with this spectrum. The absorption of the different wavelengths results in the visual expression of the color of the object.
- If the object appears blue it is because the object absorbed most of the white light selectively, reflecting only the blue portion, which is observed by the eye.
- Likewise, if an opaque object is red, it absorbs all the white light except the red portion.
- White and very light objects produce a reflectance curve which is essentially flat high on the lightness scale (reflecting all wavelengths), and black objects produce a curve which is essentially flat low on the lightness scale (absorbing all wavelengths)
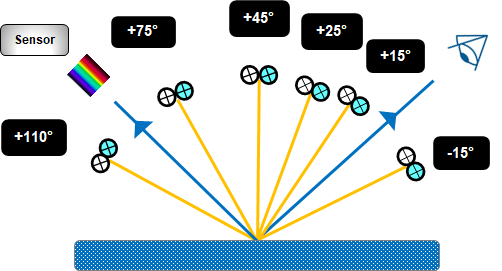
BASICS ON VIEWING ANGLES
The spectrophotometer is a device measuring and recording the interaction between the light and the surface. The transferred measurement values are transferred to the software and visualized as curves.
With effect colors, color appearance depends on the angle from which we are looking at an object.
Therefore, a spectrophotometer is taking measurements from different angles.
The different viewing angles are displayed as different curves in the software.
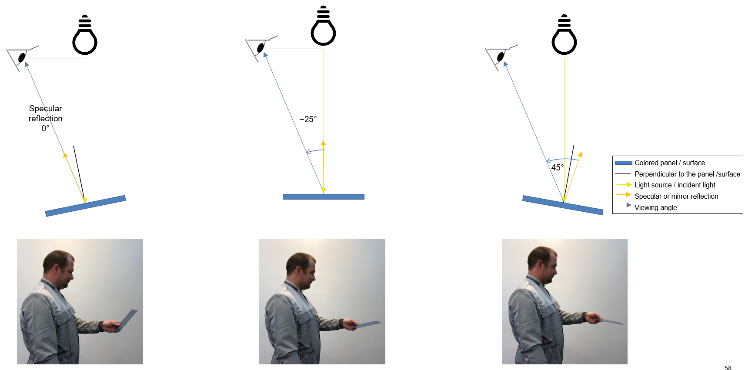
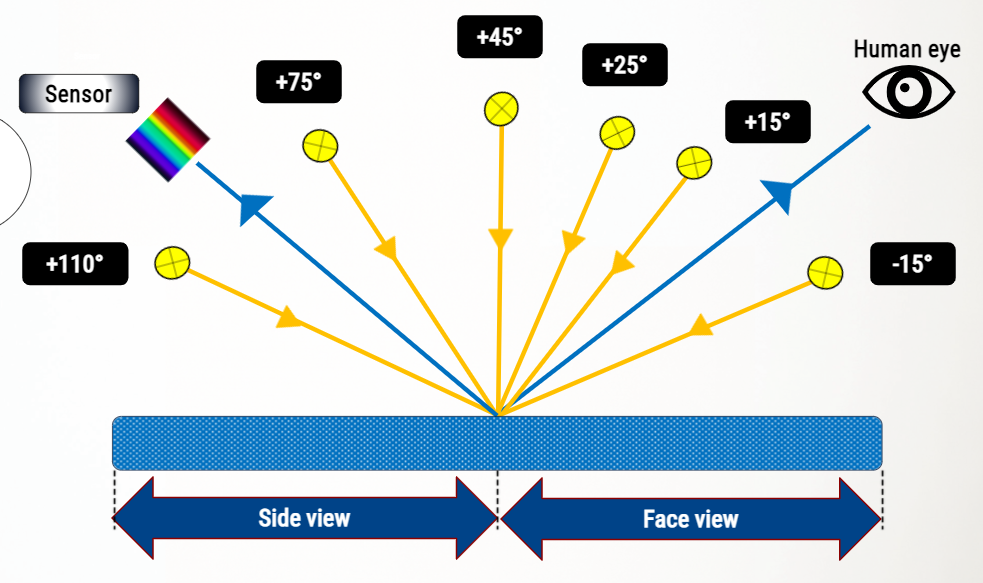
The angle value describes the angle of the specular light reflection and the viewing angle.
Angles between 0° and 45° are representing the so-called face view.
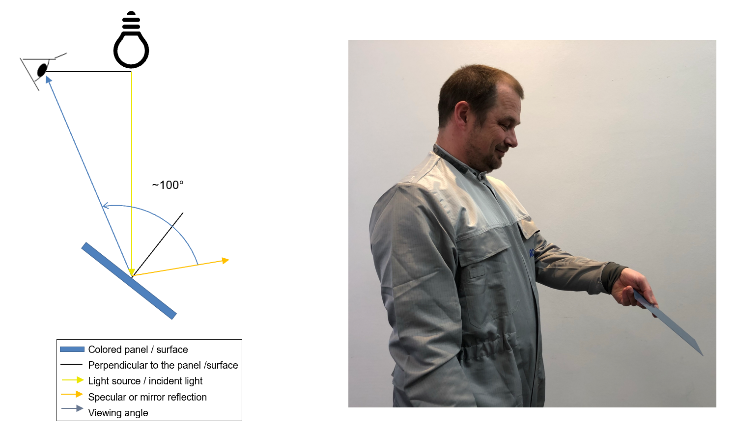
Angles between 75° to 110° are those representing the so-called flop view.
Comparing your measurement curves with the curves of solutions provided by the software will help you to make an educated decision on which solutions is the best.
The following section introduces you to the methodology of spectral curve evaluation.
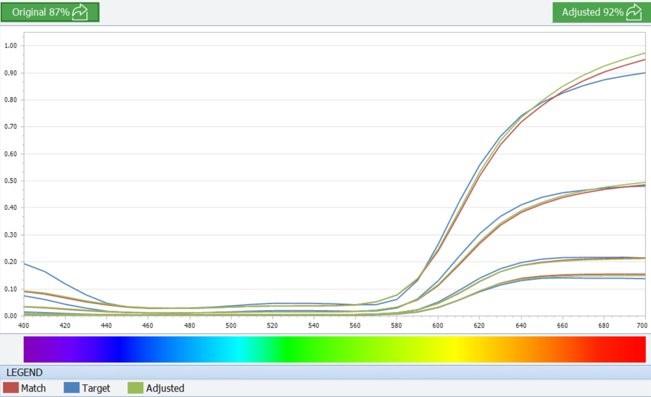
READING OF SPECTRAL CURVES

Spectral curves relevant for your solution can be accessed within the application from in the “spectral curve” tab. In the Best Match screen, the spectral curves can be found under the Details Button.
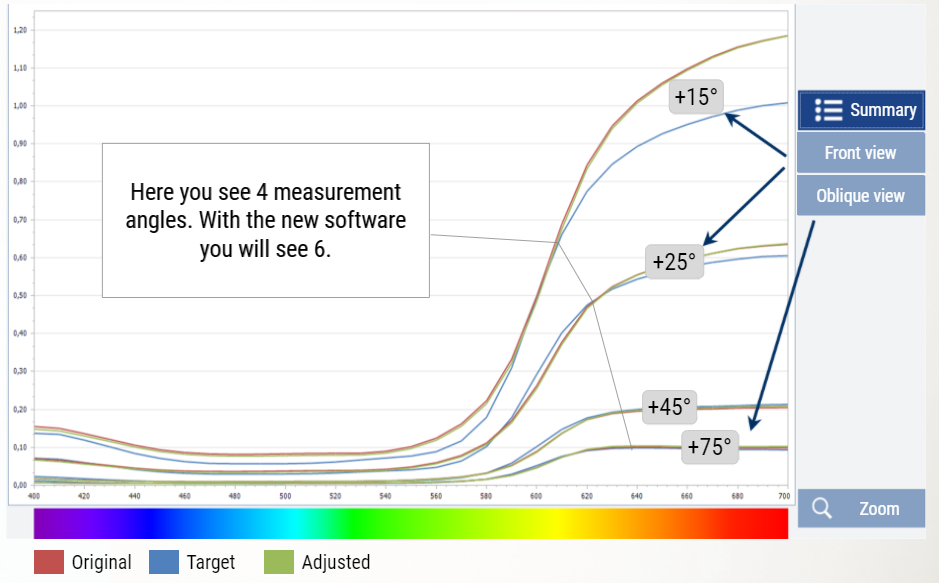
Depending on the device you have been using to take your measurement, you will see groups of curves representing the different measurement angles as described in chapter "BASICS ON VIEWING ANGLES".
The color coding of the curves helps you to identify which curve represents which solution:
Blue curve is representing the measurement you have taken with your device on your target.
The red curve represents the measurement of the suggested solution developed in the color labs aka original.
The green curve is a calculation of the spectral reflectance for the adjustment suggestion by the algorithm.
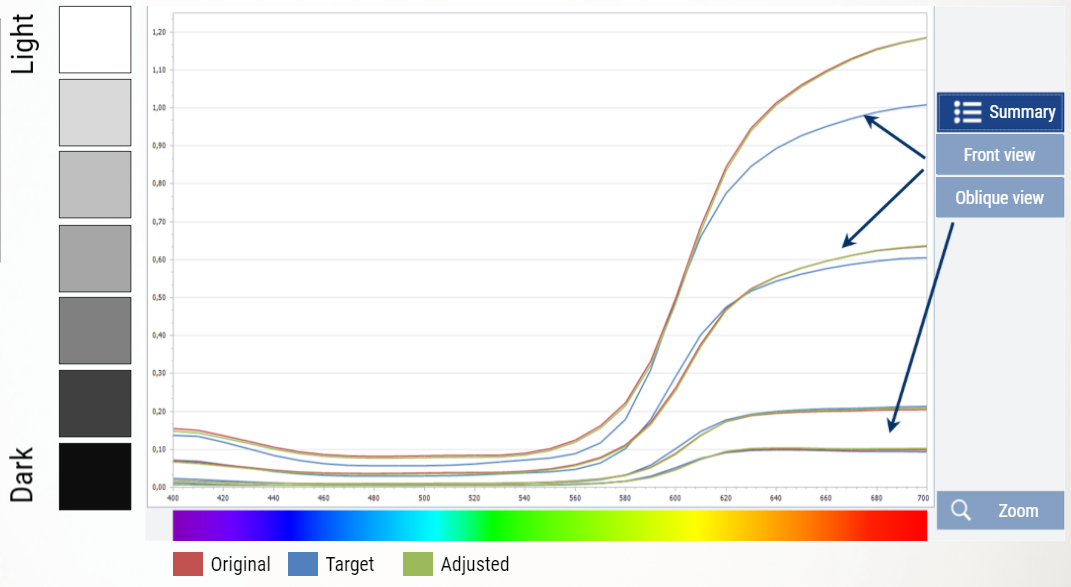
The vertical scale of the graph indicates the lightness or reflectance. Curves reaching the top of the graph indicate a color that is lighter, which is reflecting more light.
Curves at the bottom indicate a dark color which has less reflectance.
NOTE: The numerical vertical scale indicating the lightness will be adjusted depending on your color or display – please check scaling when evaluating and comparing curves!
On the horizontal scale you will see a visualization of the visible light spectrum.
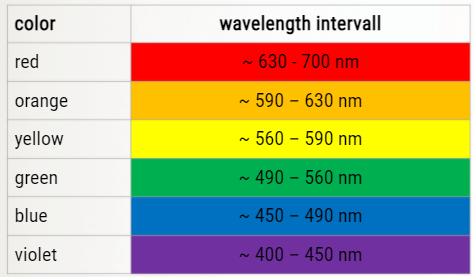
Curves with visible light spectrum
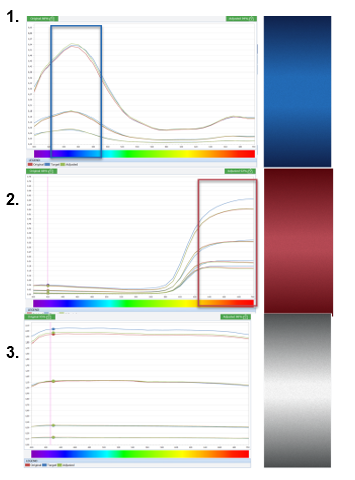
EXAMPLE OF SPECTRAL CURVES
BLACK:
Very low values on the vertical axis indicating low lightness / reflectance.
Absorption of light in all wavelengths
DARK BLUE
Low values on the vertical axis indicating low lightness.
Maximum reflectance of light in wavelength area of blue light.
DARK RED
Low values on the vertical axis indicating low lightness.
Maximum reflectance of light in wavelength area of red light.
WHITE
High lightness values on the vertical axis.
Color reflectance over all wavelengths.
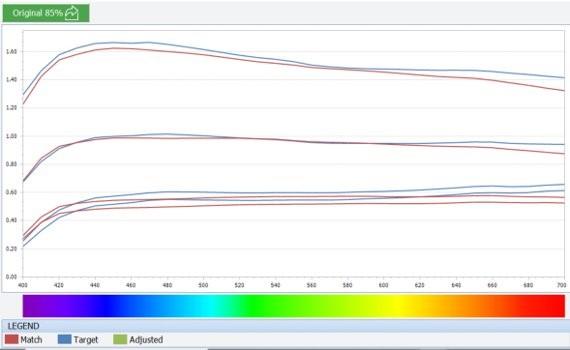
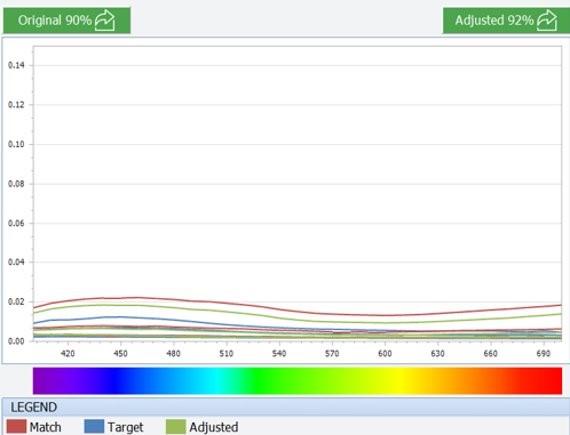
INTERPRETING OF CURVES
The comparison of curves helps you to identify how good the suggested solutions fit to the measured target. For a best color match, the curve of a suggested solution (e.g., original or adjusted) shall be as close as possible to the curve of the target. The solution curve should also be flowing smoothly parallel with the target curve.
If the angular distance between the curves (target & original or adjusted) it too big, the color result will be lighter or darker:
If the red curves (original database) and green curves (corrected solution) are below the target the color solutions are darker than the target.
If the red curves (original database) and green curves (corrected solution) are above the target the color solutions are lighter than the target.
Aligned peaks, where the maximums are not offset, show a good alignment of pigmentation in the target and the solution and hence a high probability of a good physical match. Peaks that do not align or curves even crossing each other are a clear indication that the pigmentation alignment is not correct.
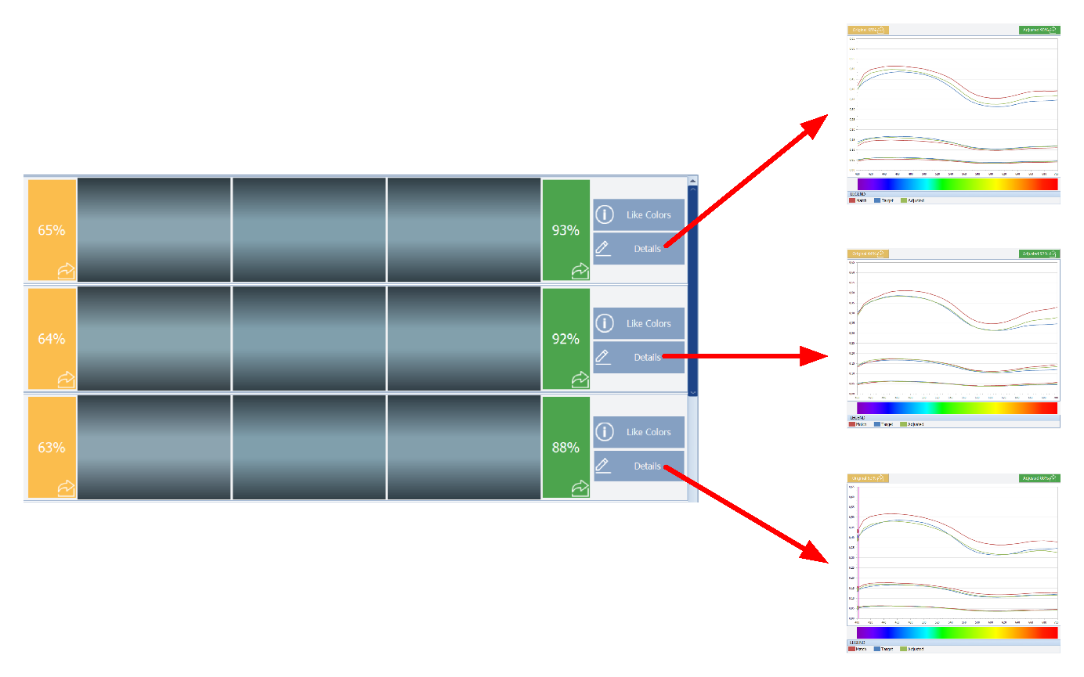
There are certain indicators which clearly show which solutions are not to be considered as a satisfactory solution.
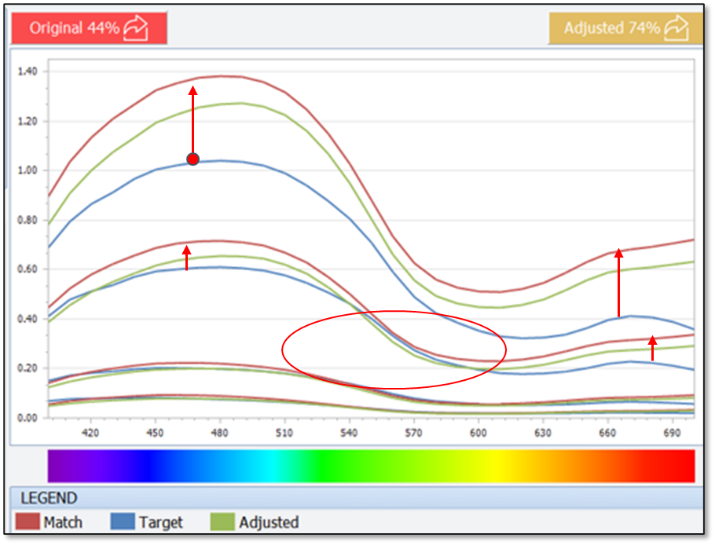
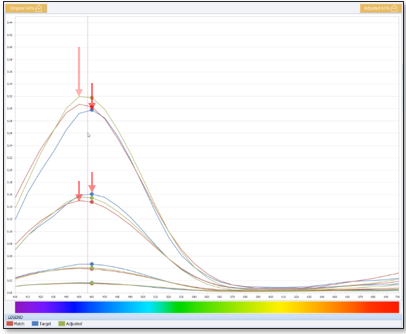
In this example, the original solution (red) shows a high deviation in lightness to the target. This deviation is also represented in the low percentage value for the original match with 44%.
Also, the curve of the adjusted solution (green) still shows a substantial deviation to the target. The crossing of the curves which clearly indicated a bad correlation of the solutions, can be observed between the blue and green curves (Circled).
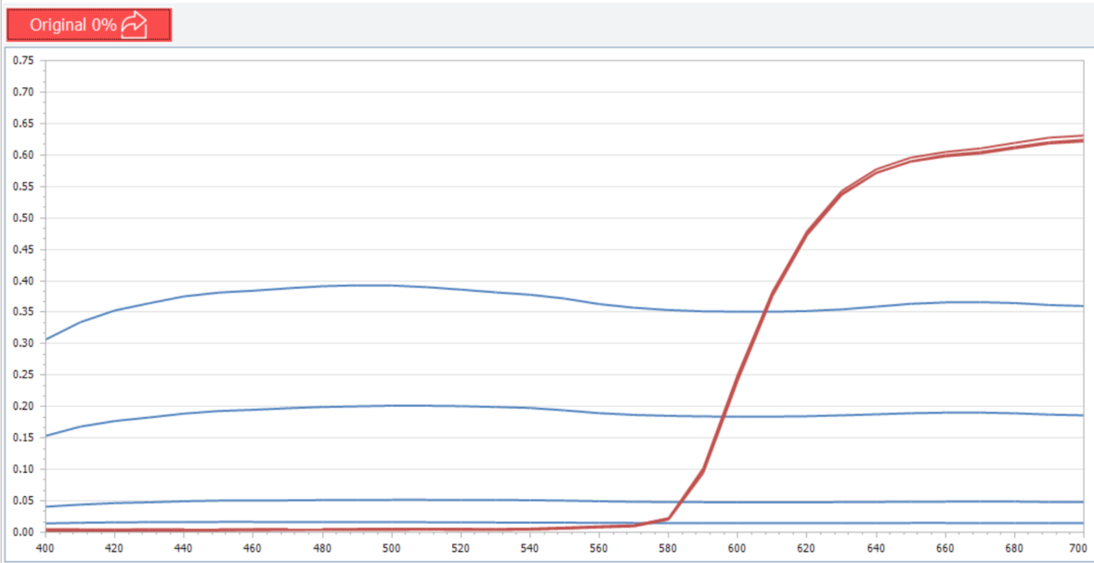
In this example, we can clearly identify the match is not even the same color as the target and quality score is 0%. This was a metallic target searched as a solid 45° angle returned.
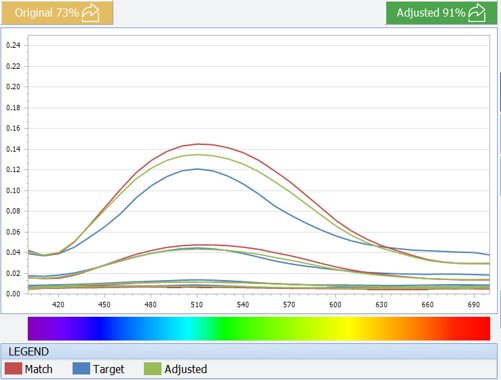
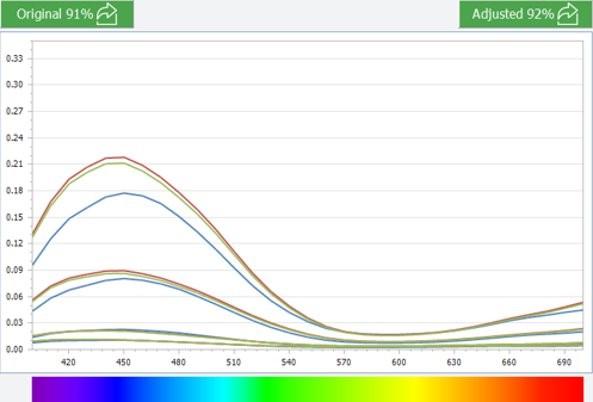
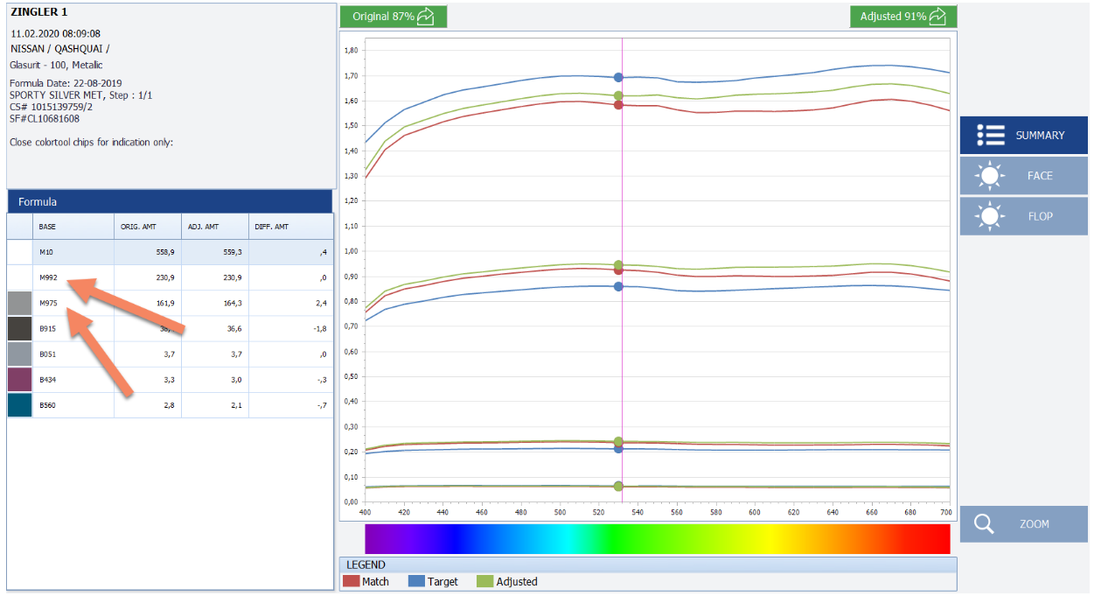
This example shows a result with an original quality score of 73% and an adjusted of 91%.
This graph can signify the match and the target will be a bit brighter in the 15°. The area which the lines cross and the spectral curves do not flow together can signify different pigmentations.
In this case it is advised to check the tinting bases and select a match that contains the expected pigment/ effects and do a spray out.
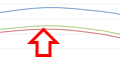
When comparing suggested solutions for the same target, please also pay attention to the alignment of peaks on the curves.
|
Smooth curves with peaks aligned. This look good! |
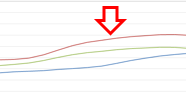
Although the curves look closer here the peaks do not align. This is a clear indication for pigmentation issues in suggested solution! |
EVALUATION OF FORMULA
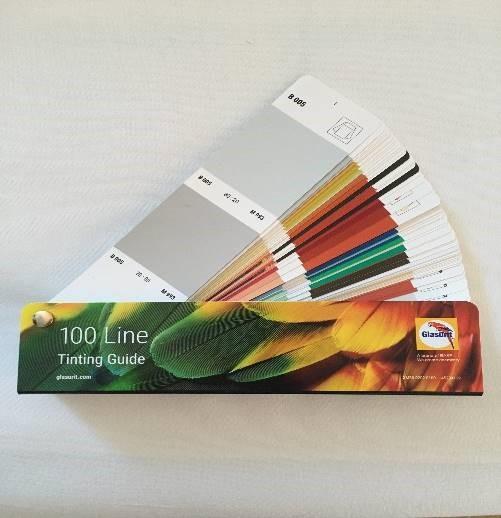
The tinting guide is a tool to support your decision-making process for evaluation of the formula and the contained tinters.
How does the “Tinting guide” fit into a digital only approach?
It provides a visual representation of the individual tinting bases and their coloristic behavior.
It can help to compare effect pigments visible in the target repair formulation to those available in the paint line portfolio.
How to use the “tinting guide” for solution decision making?
Look at effect pigments/metallic suggested in the formula in the software.
Look up the coarseness level and the appearance of the pigments in the tinting guide.
Compare the coarseness and the appearance of tinting guide spray out to the target coating on the car to confirm formula has the right effect pigment.
When the pigment in the solution do not match the target, please check further available solutions.
SELECTION OF THE BEST MATCH
To select the best match among the results provided you will use your skills in spectral curve and formulation interpretation supported by a solution sorting provided by the software.
The results on the best match screen of your software are sorted based on calculated color difference values between the target and the original -> Best value on top.
The stoplight coloring and the percentage values are an indicator in which order you should consider & evaluate the results returned from the database.
The percentage is based on the “Color difference” between the measurement values of the two solutions (original vs. target) or the measurement value and the calculated color values (target vs. adjustment) over all measurement angles.
It does NOT define if a solution will result in an edge-to-edge, a blending, etc. solution.
The following section will provide you some guidance on how to make your way through the proposed solutions in the software towards the right solution to be brought to spray out for color validation.
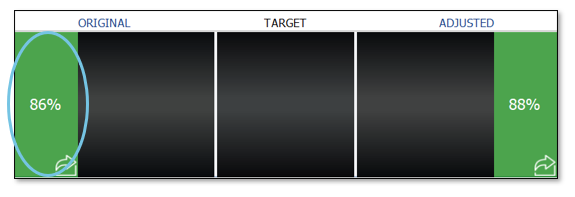
WHAT TO CONSIDER FIRST: DISPLAY AND SELECTION OF YOUR “BEST MATCH”?
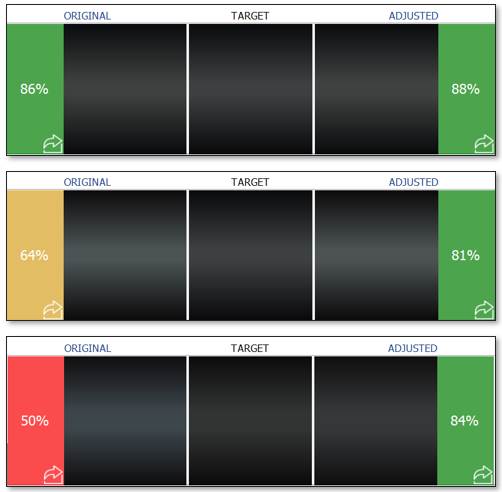
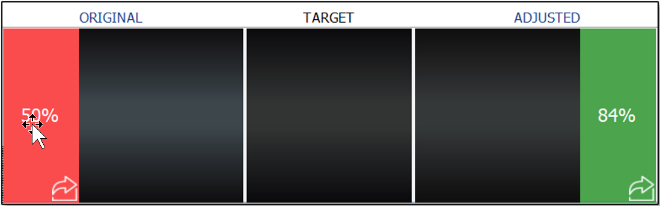
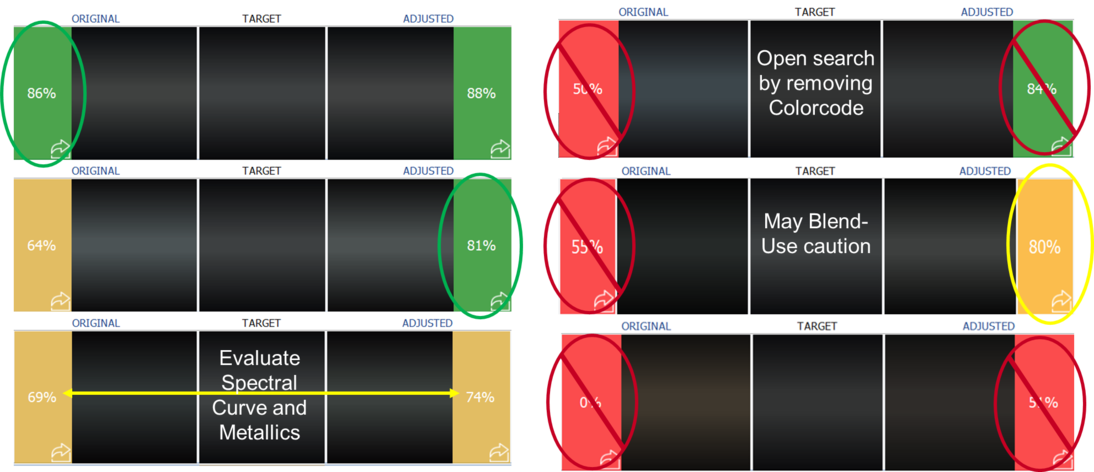
Best Solution - Both the Original and the Adjusted formulas are GREEN Evaluate the original first! Remember, this is the formulation developed by the color experts in the labs which is returned from the database as the best solution. Confirm your choice by evaluating the spectral curves.
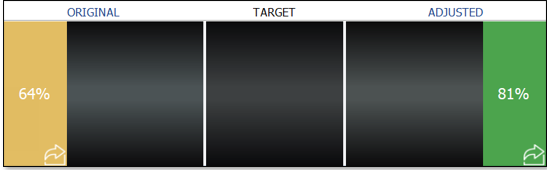
Best Solution - The Original is YELLOW, and the Adjusted formula is GREEN
In this case evaluate the adjustment first and consider taking to mixscreen and make a spray out. If Original is yellow and the adjusted is green the adjustment can be a better solution. Always be sure to check the spectral curves and assure the correct metallics.
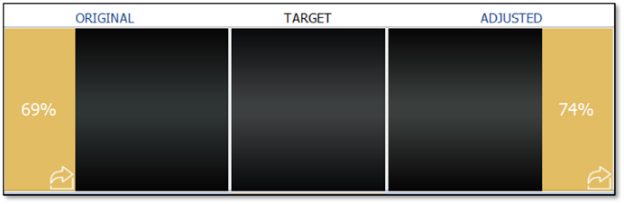
Best Solution - The Original is YELLOW, and the Adjusted formula is YELLOW
In this case use your knowledge to decide and make a spray out. Be sure to check the spectral curves and assure the correct metallics and base your choice on this knowledge.
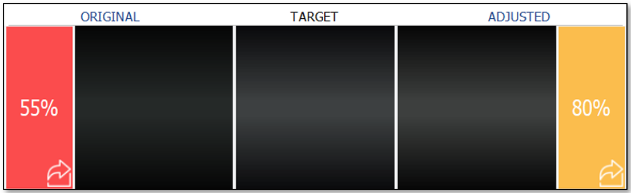
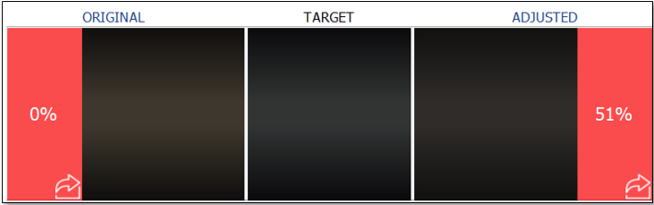
Best Solution - The Original is RED, and the Adjusted formula is Yellow
The yellow adjusted MAY produce a blending match. Be sure to check spectral curves of the adjusted and the metallics in the formula using the tinting guide or the wall chart!!
In this case, it is best to open the search to find a better match. Since you started with a MFG and CODE search again by removing the CODE and search with MFG only to find a better result. You might also try the alternative search leaving out the MFR in case you are searching for a vehicle belonging to a MFR group.
If the result continues to be at a “red” level after opening the search, we are lacking color in the database. Please collect a car part and submit a color service request - with your request you are helping to grow the database!
Best Solution - The Original is RED, and the Adjusted formula is GREEN
It is rare a red adjusting to a green will produce a good result. In this case it is best to open the search to find a better match. Since you started with a MFG and CODE search again by removing the CODE and search with MFG only to find a better result. You might also try the alternative search leaving out the MFR in case you are searching for a vehicle belonging to a MFR group.
If the result continues to be at a “red” level after opening the search, we are lacking color in the database. Please collect a car part and submit a color service request – with your re
Best Solution - The Original is RED, and the Adjusted formula is RED
With results like this it is best to redo your scan. Subsequently, you might want to open your search. If this continues after a rescan and re-search, we are lacking color in the database. Please collect a car part and submit a color service request.
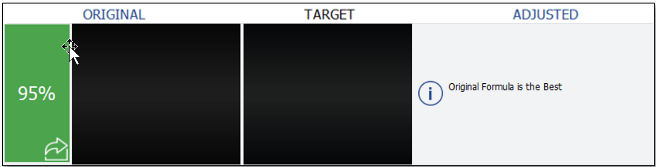
Best Solution - The Original is GREEN or YELLOW and the Adjusted formula is not available.
In this case evaluate this result in comparison with the other results suggested using spectral curve and metallics and evaluate if the suggested original is the best fit.
If none of the 5 MFG and CODE results are satisfactory it is recommended to open the search by first removing the CODE, again checking both spectral curve and metallics. You might also try an alternative search leaving out the MFR in case you are searching for a vehicle belonging to a MFR group.
WHY DOES THE SOFTWARE SOMETIME RETURN ONLY “YELLOW” OR “RED” RESULTS?
The limitation of you search criteria did limit your results -> modify search criteria as described in chapter "SEARCH MODIFICATION".
There is no suitable solution in the database yet -> provide car part and reach out to color service. By doing so, you are helping to grow the number of solutions to be retrieved from the database!
QUALITY SCORE QUICK GUIDE
-
To be used as a guide for a starting point only!!!
-
Always be sure to check that spectral curves flow smoothly, and peaks align with minimal crossing.
-
Always check metallics.
-
Validate your choice with a spray out!
RECAP - EVALUATION OF SOLUTIONS IN THE SOFTWARE
Perform your search with as much information as possible to limit relevance for search and improve search performance.
Evaluate Original first if the result is > 80% - it represents the formula which has been developed by the color experts in the lab based on a panel of the respective MFR and Color code.
If the "ORIGINAL" value is under 80% CLICK on the DETAIL button. Do not select the "ORIGINAL" solution.
Visualize the spectral curve of each solution. Select the most suitable solution. Take the nearest curves. Limit discrepancies. Avoid intersecting curves.
WHAT TO DO IF YOU HAVE MULTIPLE RESULTS SHOWING VERY GOOD CURVE ALIGNMENT? As it is easier to correct lightness than color select the “lighter” curve for your spray out.
Evaluate the result formula for correct aluminum / effect type using the tinting guide letdown and the coarseness indication of the metallic pictogram.
The spray-out library is the collection of spray-outs created by the individual painter. A spray-out provides the most accurate information for deciding on repair options. To fully benefit from the spray out library, the samples have to be created under real repair conditions and the individual spray-outs require detailed labeling.
Fore more information about Spray-outs, see module BASIC KNOWLEDGE - COLOR, chapter "PREPARING A SPRAY OUT".
ADJUSTMENT
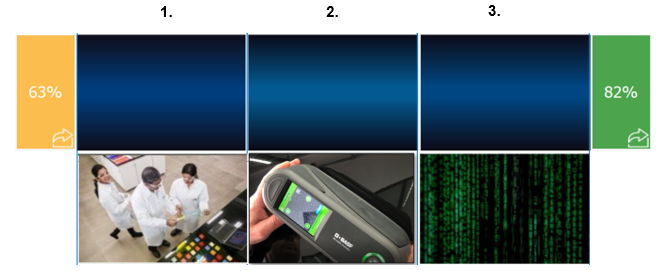
1: Original, real spray out from the lab; 2: Target, your scan; 3. Adjusted, algorithm calculation
Within your color retrieval, adjustments can be helpful if the color is almost there but may need additional adjustment. These are optional improvement steps of the formular in case the initial mixed formular is not satisfactory which are performed utilizing computer-based calculations.


